






Skip to content

5 Monthly Numbers Every Practice Owner Should Track

Revenue tells you what came in. It doesn’t tell you what’s driving it, where clinical capacity is being lost or whether the money is actually reaching the bank.

Running a practice means balancing patient care with the financial and operational demands of a business, and monthly revenue is a useful starting point. But it only tells part of the story. A full appointment book doesn’t mean every appointment is attended and billed. Strong revenue doesn’t mean cash flow is healthy. And a busy month can hide the fact that each session is earning less than it used to.

A regular review of the right numbers can show you how effectively clinical time is being used, where appointments are being lost, how reliably payments are collected and whether the practice is growing.

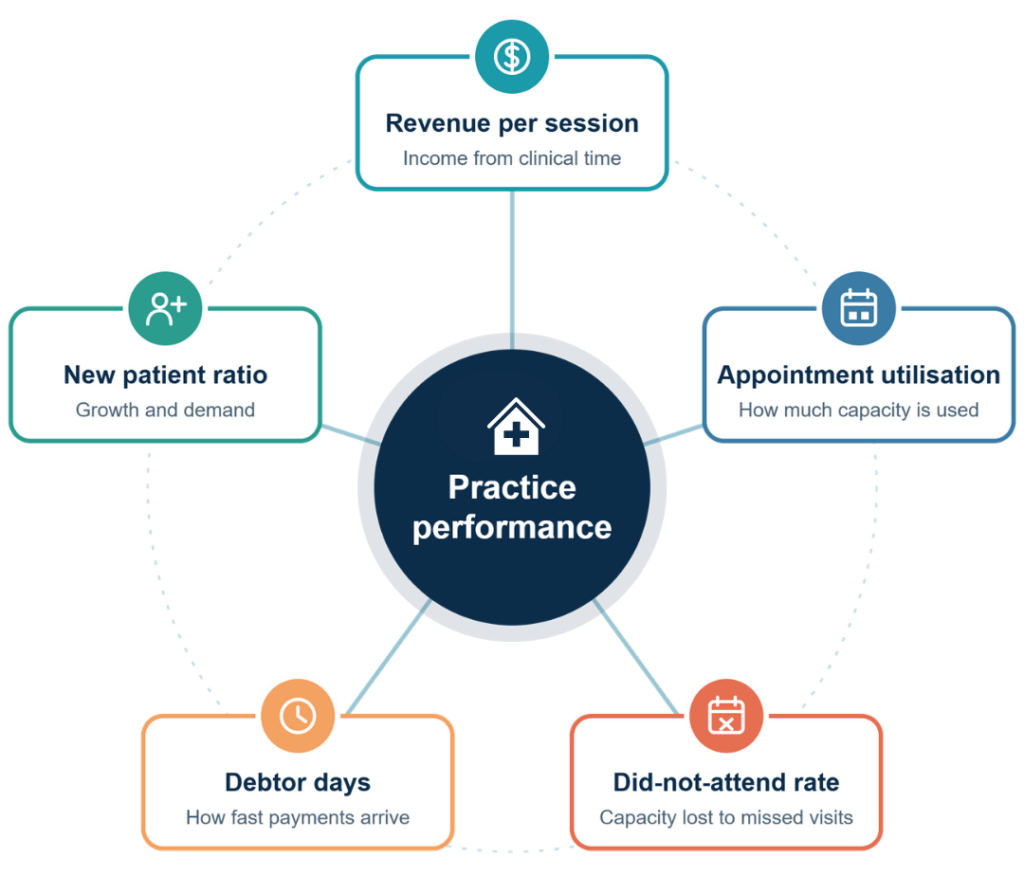
So which numbers should you be looking at? Here are five metrics worth including in your monthly practice reporting, with what each one measures, how to calculate it and what the results can tell you.

Revenue per session - How much revenue does each clinical session generate?

Revenue per session is the average income generated by each clinical session. It shows how effectively the practice converts clinical activity into billable services. Total monthly revenue alone can mislead. If it rises because a clinician added another day, the practice is earning more, but the return from its existing sessions hasn’t necessarily improved. Revenue per session puts that growth in perspective.

How it's calculated

Revenue generated from clinical sessions ÷ Number of clinical sessions

Example: A practice generates $40,000 across 100 clinical sessions in a month. Its average revenue per session is $400.

What the numbers can tell you

A falling figure may point to fewer completed consultations, a change in the mix of services or billing that hasn’t been completed. It may also reflect seasonal demand. A rising figure may suggest stronger appointment numbers, a shift in consultation types or more consistent billing.

The key is understanding the driver. If appointment numbers hold steady but revenue per session falls, check whether all billable services are being captured and billing is completed consistently.

What to monitor

Compare month to month and across clinicians, allowing for differences in working hours, consultation types and services. Comparing revenue against completed consultations will also show changes in average revenue per appointment.

Tip: Use revenue generated or billed for the relevant sessions, not payments received. Otherwise, collection delays will distort the result.

Appointment utilisation - how much of your capacity is being used?

Appointment utilisation is the proportion of available appointment time that is filled by bookings. It shows whether your clinical capacity is being used well and whether availability matches patient demand. It can also expose scheduling imbalances that aren’t obvious from the appointment book. A clinician may be full on Monday and Tuesday with significant gaps later in the week, something overall appointment numbers would hide.

How it's calculated

Booked appointment time ÷ available appointment time × 100

Example: A clinician has 30 hours of available appointment time in a week and 24 hours are booked. Their utilisation rate is 80%.

What the numbers can tell you

Consistently low utilisation may mean you have more capacity than demand requires, or that gaps, limited booking options or clustering on certain days are getting in the way.

High utilisation suggests strong demand, but it has a flip side. If every appointment is booked well in advance, there may be little room for urgent appointments or new patients. That matters for access to care: the Australian Institute of Health and Welfare (AIHW) reports that 27% of Australians who needed to see a GP in 2024–25 delayed seeing one or did not see one when needed, with long waits and service availability among the reasons given. Practice-level figures can’t explain that on their own, but they can show you where your own capacity is constrained.

What to monitor

Compare utilisation across clinicians, days and appointment types. Check how far ahead appointments are booked and whether certain appointment types regularly run short of availability. Exclude time reserved for administration, meetings and breaks from available capacity so utilisation isn’t over- or understated.

What good utilisation looks like: Targets vary by practice type, but very high utilisation sustained for long periods can signal a capacity problem rather than a success. Set your own baseline first, then track movement against it.

Did-not-attend rate - How much appointment time is lost to missed visits?

The did-not-attend (DNA) rate is the percentage of scheduled appointments where the patient doesn’t attend and hasn’t cancelled within your cancellation window. A missed appointment is more than a gap in the day. It’s lost billable time, unused clinician capacity and a slot another patient may have been waiting for. The impact adds up quickly when it happens regularly across several clinicians.

How it's calculated

Number of DNA appointments ÷ total appointments due to take place × 100

Example: A practice has 500 appointments scheduled in a month and 25 patients do not attend. Its DNA rate is 5%.

What the numbers can tell you

A high or rising DNA rate may point to problems with reminders, patient communication or the booking process. The overall percentage is only part of the picture, so look at the patterns:

  • Are early morning or late afternoon appointments missed more often?

  • Do longer appointments have higher non-attendance?

  • Are certain days or clinicians affected more?

  • Are patients cancelling at short notice, leaving no time to offer the slot to someone else?

These answers help you decide whether to change reminder processes, cancellation policies or appointment management.

Guidance from the Royal Australian College of General Practitioners (RACGP) on online appointment technology identifies automated reminders as one way to reduce non-attendance. It also notes that online booking gives patients more flexibility to manage routine appointments outside reception hours.

What to monitor

Track the rate monthly and separate genuine non-attendance from cancellations and reschedules. Track late cancellations separately too, as they can have a similar effect on capacity. Reading DNA rates alongside utilisation shows how much clinical time is actually being lost.

Debtor days - how long does it take to collect what you're owed?

Generating revenue doesn’t mean the money is in the bank. Debtor days, also called days sales outstanding (DSO), measure the average time it takes to collect payments owed to you. A practice can perform well on consultations and billings and still face cash flow pressure if payments are consistently slow.

If most of your patients pay at the time of service, this metric matters less for that portion of your income. It is most useful for the receivables you do carry, such as patient accounts, third-party payers (for example DVA or WorkCover), insurer payments and other claims.

How it's calculated

Average accounts receivable ÷ credit sales for the period × Number of days in the period

Example: A practice has average outstanding receivables of $30,000 and generates $90,000 in credit sales over a 90-day period. Its debtor days are 30.

What the numbers can tell you

Rising debtor days may indicate delayed invoicing, unpaid patient accounts, unpaid claims or inconsistent follow-up. It also matters where the outstanding money sits. A large number of overdue patient accounts calls for a different approach than delays with insurers or third-party payers.

Business Queensland’s guidance on cash flow highlights the importance of managing debtors, monitoring outstanding payments and understanding how payment delays affect the money available to run a business. For a practice, that means looking beyond the total owed to how long individual accounts have been outstanding.

What to monitor

Review debtor days alongside an accounts receivable ageing report, grouping balances into 0–30, 31–60, 61–90 and 90+ days to see where debts are building up. Also track the percentage of accounts that are overdue and whether follow-ups happen consistently. Lower debtor days generally mean faster collection, but payment terms, payer mix and the nature of your services all affect how you interpret the number.

New patient ratio - How much of your patient base is new?

The new patient ratio is the proportion of unique patients seen in a period who are attending the practice for the first time. It indicates how well you’re attracting new patients and keeping the door open for growth. For an established practice, a steady flow of new patients offsets those who relocate, change providers or no longer need regular care. For a newer practice, it shows whether awareness and referrals are turning into patient demand.

How it's calculated

Number of new patients ÷ total unique patients seen × 100

Example: A practice sees 800 unique patients in a month, including 80 new patients. Its new patient ratio is 10%.

What the numbers can tell you

A declining ratio may reflect fewer referrals, lower visibility in the community or limited availability for new patients. A lower figure isn’t automatically a concern, though. An established practice with a strong base of returning patients will naturally have a smaller share of new patients than a recently opened clinic.
The more useful question is whether you’re attracting enough new patients to meet your business objectives while keeping your existing ones. Knowing where new patients come from helps too. Referral sources such as existing patients, other health professionals, online searches and local networks show which channels are working.

What to monitor

Track new patient numbers and the ratio over time, and record how patients heard about you. Look at retention alongside this metric. A steady flow of new patients is valuable, but so is knowing whether existing patients keep coming back when they need care.

Looking at the bigger picture - What happens when you connect the numbers?

Each metric offers a different perspective, but the real value comes from seeing how they influence one another. A few examples:

Revenue is rising but revenue per session is falling.

Income may be growing because clinicians are working more sessions, not because existing capacity is earning more. Review scheduling, service mix and billing before expanding clinical hours further.

Utilisation is high, but new patient numbers are falling.

Existing capacity is filling, but there may be little room for new patients. Review booking lead times and how appointments are allocated to see whether more capacity is needed.

DNA rates are rising while utilisation stays high.

The practice may look fully booked while still losing valuable clinical time to missed appointments. Look at cancellation patterns and reminder processes to recover some of that capacity.

Revenue is strong, but debtor days are increasing.

Billings may be healthy while collection slows. That puts pressure on cash flow when wages, rent and supplier payments fall due.

Turning practice metrics into better decisions

You don’t need an elaborate process. A consistent monthly review of these five metrics is a strong starting point. Establish a baseline, compare results over time and investigate changes instead of fixating on single figures.

  • Establish consistent definitions. Make sure everyone understands how each metric is calculated and which appointments, billings or accounts are included.

  • Compare like with like. Consider seasonal demand, public holidays, clinician availability and changes to the services offered when reviewing results.

  • Look beyond the overall figure. Break results down by clinician, appointment type, day or payment category where appropriate.

  • Investigate sustained changes. A single unusual month may not indicate a problem, but a consistent trend is worth exploring.

  • Connect reporting to practice goals. Use the findings to inform decisions about staffing, appointment availability, billing processes and future investment.

Revenue alone can’t tell you how well a practice is performing. Understanding how clinical time is used, where appointments are lost, how payments are collected and whether new patients are coming through the door gives you a much clearer picture, and with consistent reporting you can move from reviewing last month to deciding what to improve next.

Turn practice data into clearer decisions with MediRecords Clarity

Tracking five metrics every month is valuable, but compiling them manually across appointment books, billing records and patient lists takes time. The right reporting tools make it easier to understand what’s happening across your practice and identify where attention is needed.

MediRecords Clarity helps you:

Considering a move to MediRecords?

Choose your current system and enter your details into the form below. We’ll show your full migration breakdown, and if you’re ready to proceed, our team will be in touch with your timeframe.

Can't see your system? It can usually still move across. Reach out to our team to organise a sample data review.